Chicago Botanic Garden
Experience Strategy & UX Design for Mobile App
A community-focused, data-driven application to plant conservation for the Chicago Botanic Garden, called Budburst.

The Chicago Botanic Garden created a scientific program, Budburst, with the goal to gather plant phenological data to understand the widespread effects of climate change. The program and application needed to be rebranded and recreated as a user-centric mobile app to simplify the data collecting process and allow for engagement with other community members.
Problems to Solve
Develop the product as a mobile app for quick access to taking a photo and utilizing location data
Streamline the scientific process of the program to be more accessible and understanding to the average citizen
Allow for community gamification and social interactions between members of the app
Provide visual history on the user’s collections and data as a reference tool

features working session
Prior to building out features, we conducted a working session with the client to understand the scientific data and engagement goals of the program. Based on the current state and the ideation of future features, I began to write user stories and requirements of the features as a collaborative way to build the product with the Chicago Botanic Garden scientists. After a few working sessions, we landed on a clear direction and goals of what would be built for the experience.

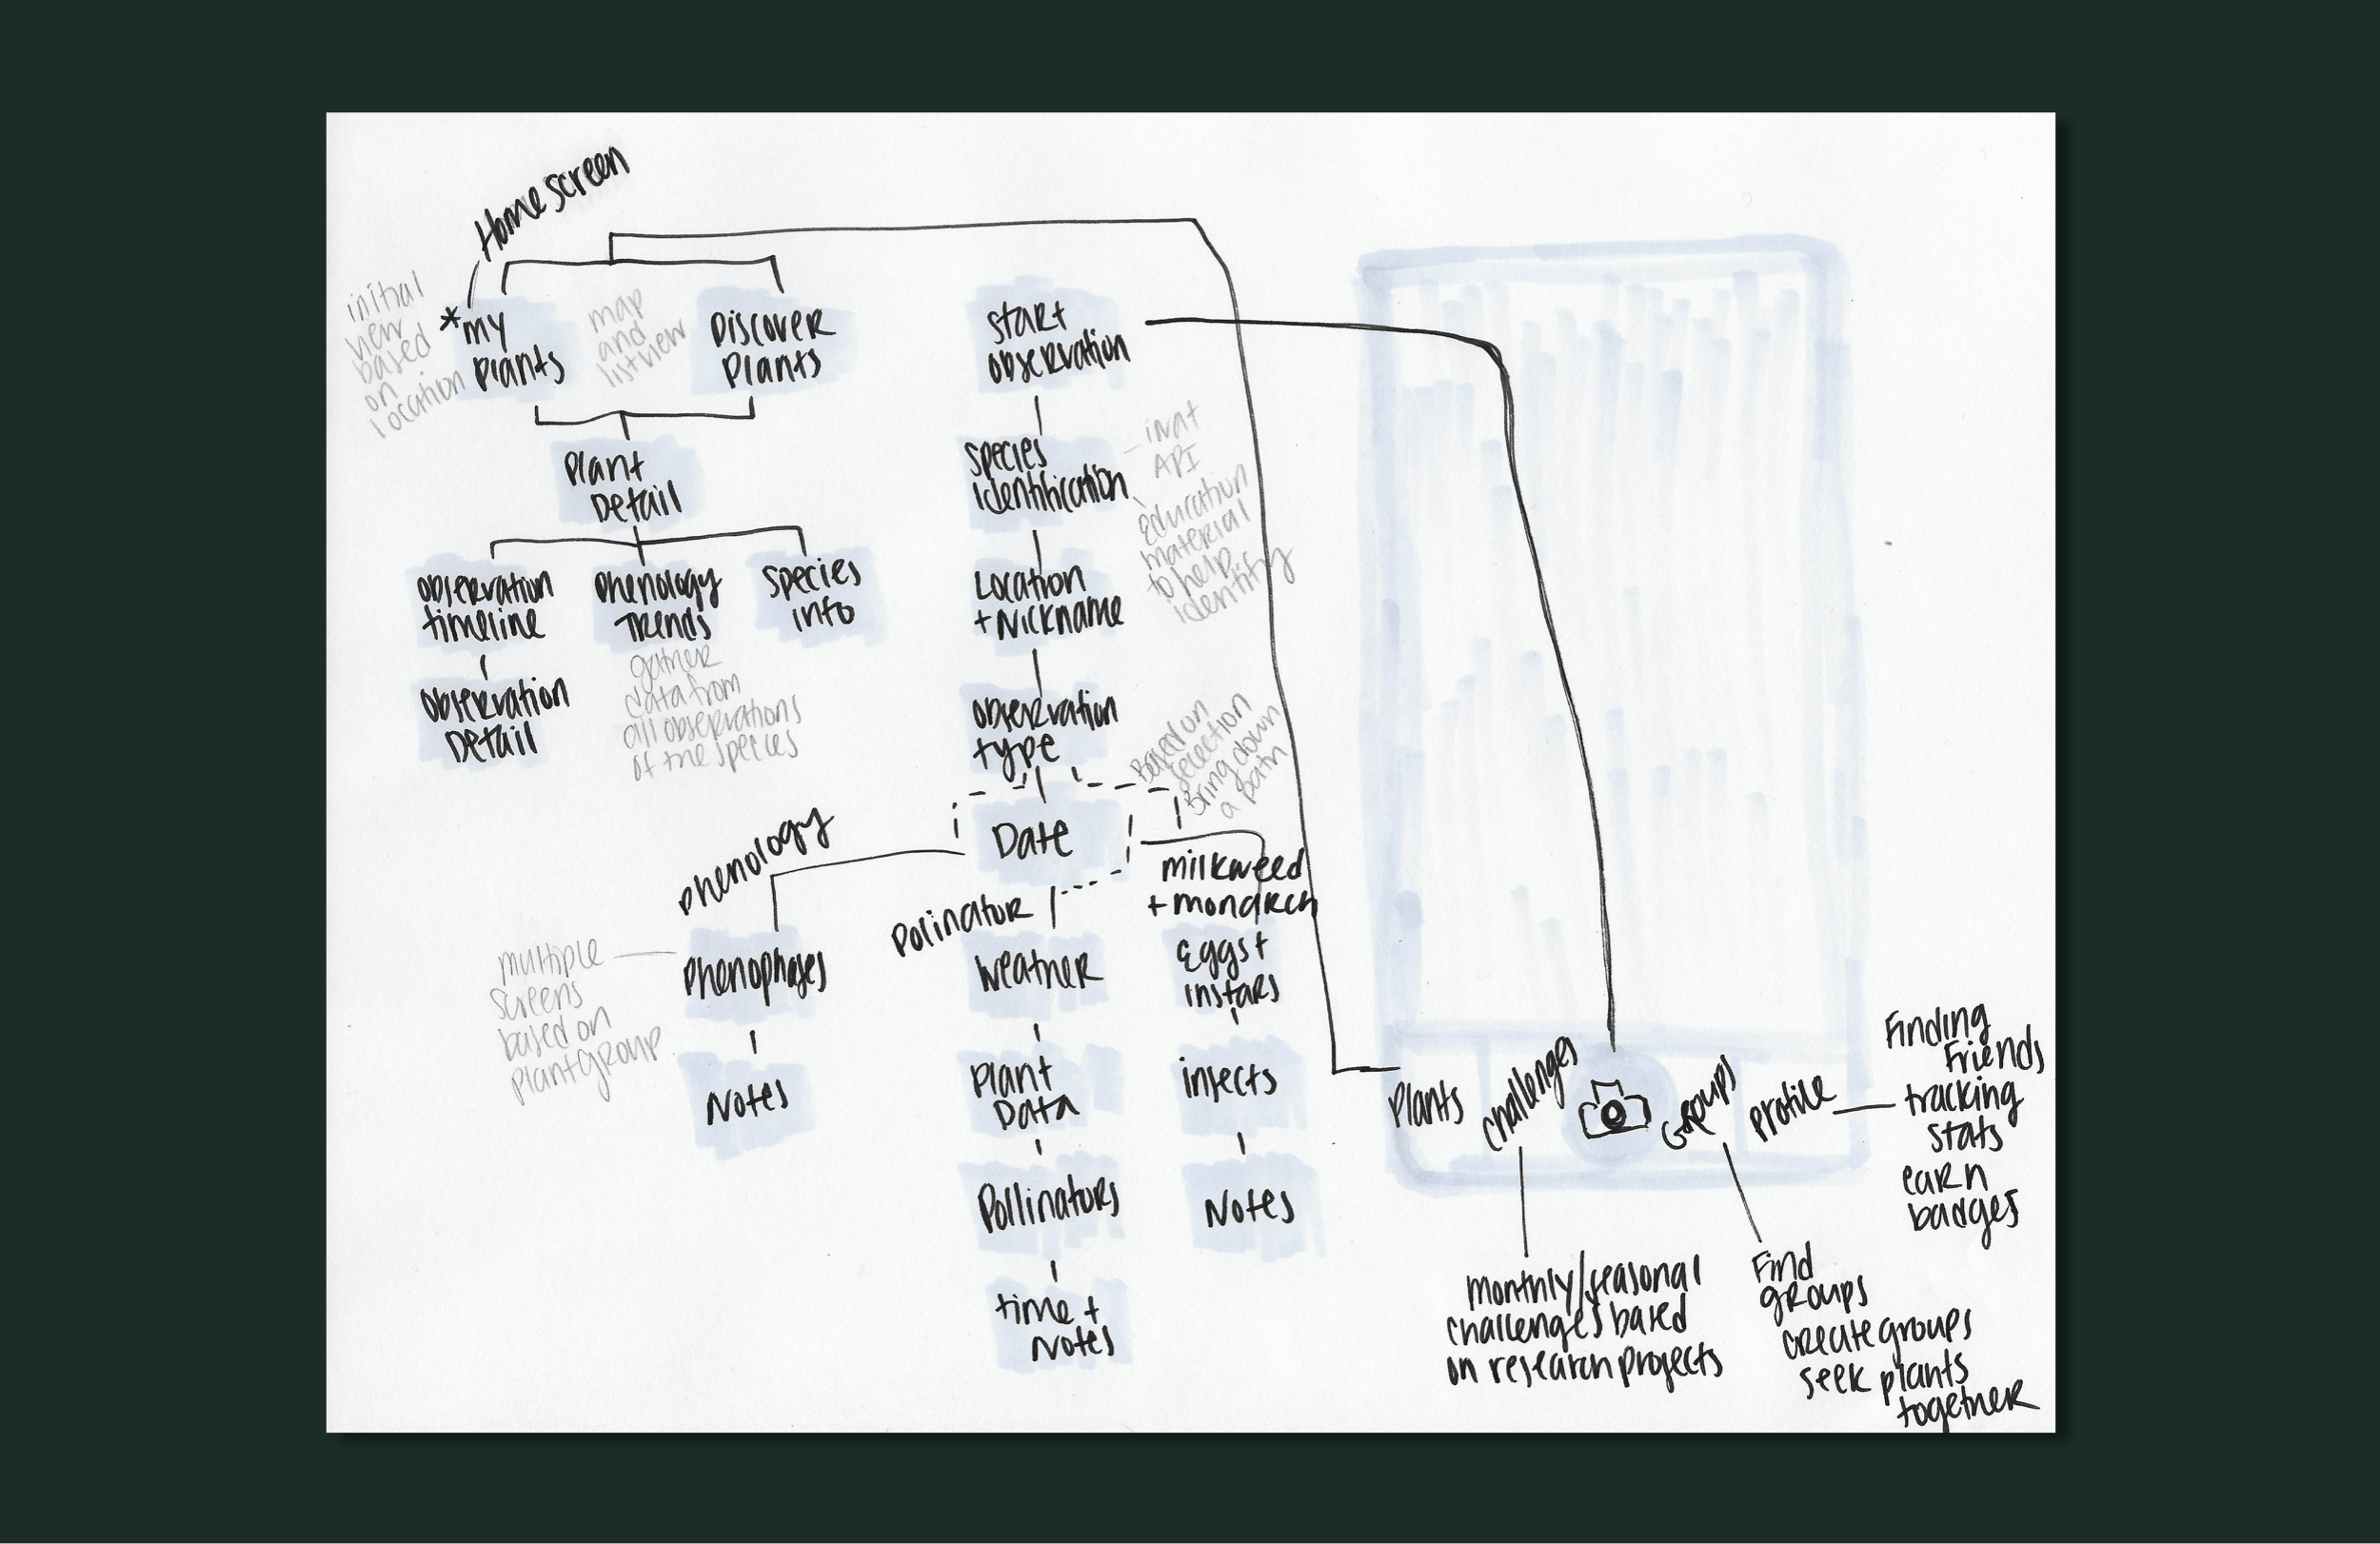
mobile app architecture
As I was designing the UX for the app, I wanted to create an experience that was educational, encouraging and fun to use. But most importantly allowed people to connect on a deeper level with the plants around them. I structured the experience all around the initial screen of a map and list of “My Plants”, instead of singular observations. This simple change in structure automatically creates an emotional connection to the plants you have observed. I simplified the observation process, implemented community based features and encouraged engagement through challenges and milestones to earn badges. Overall, it pushed the boundaries of the program and rethought the structure of the experience, while still adhering to the scientific protocol.

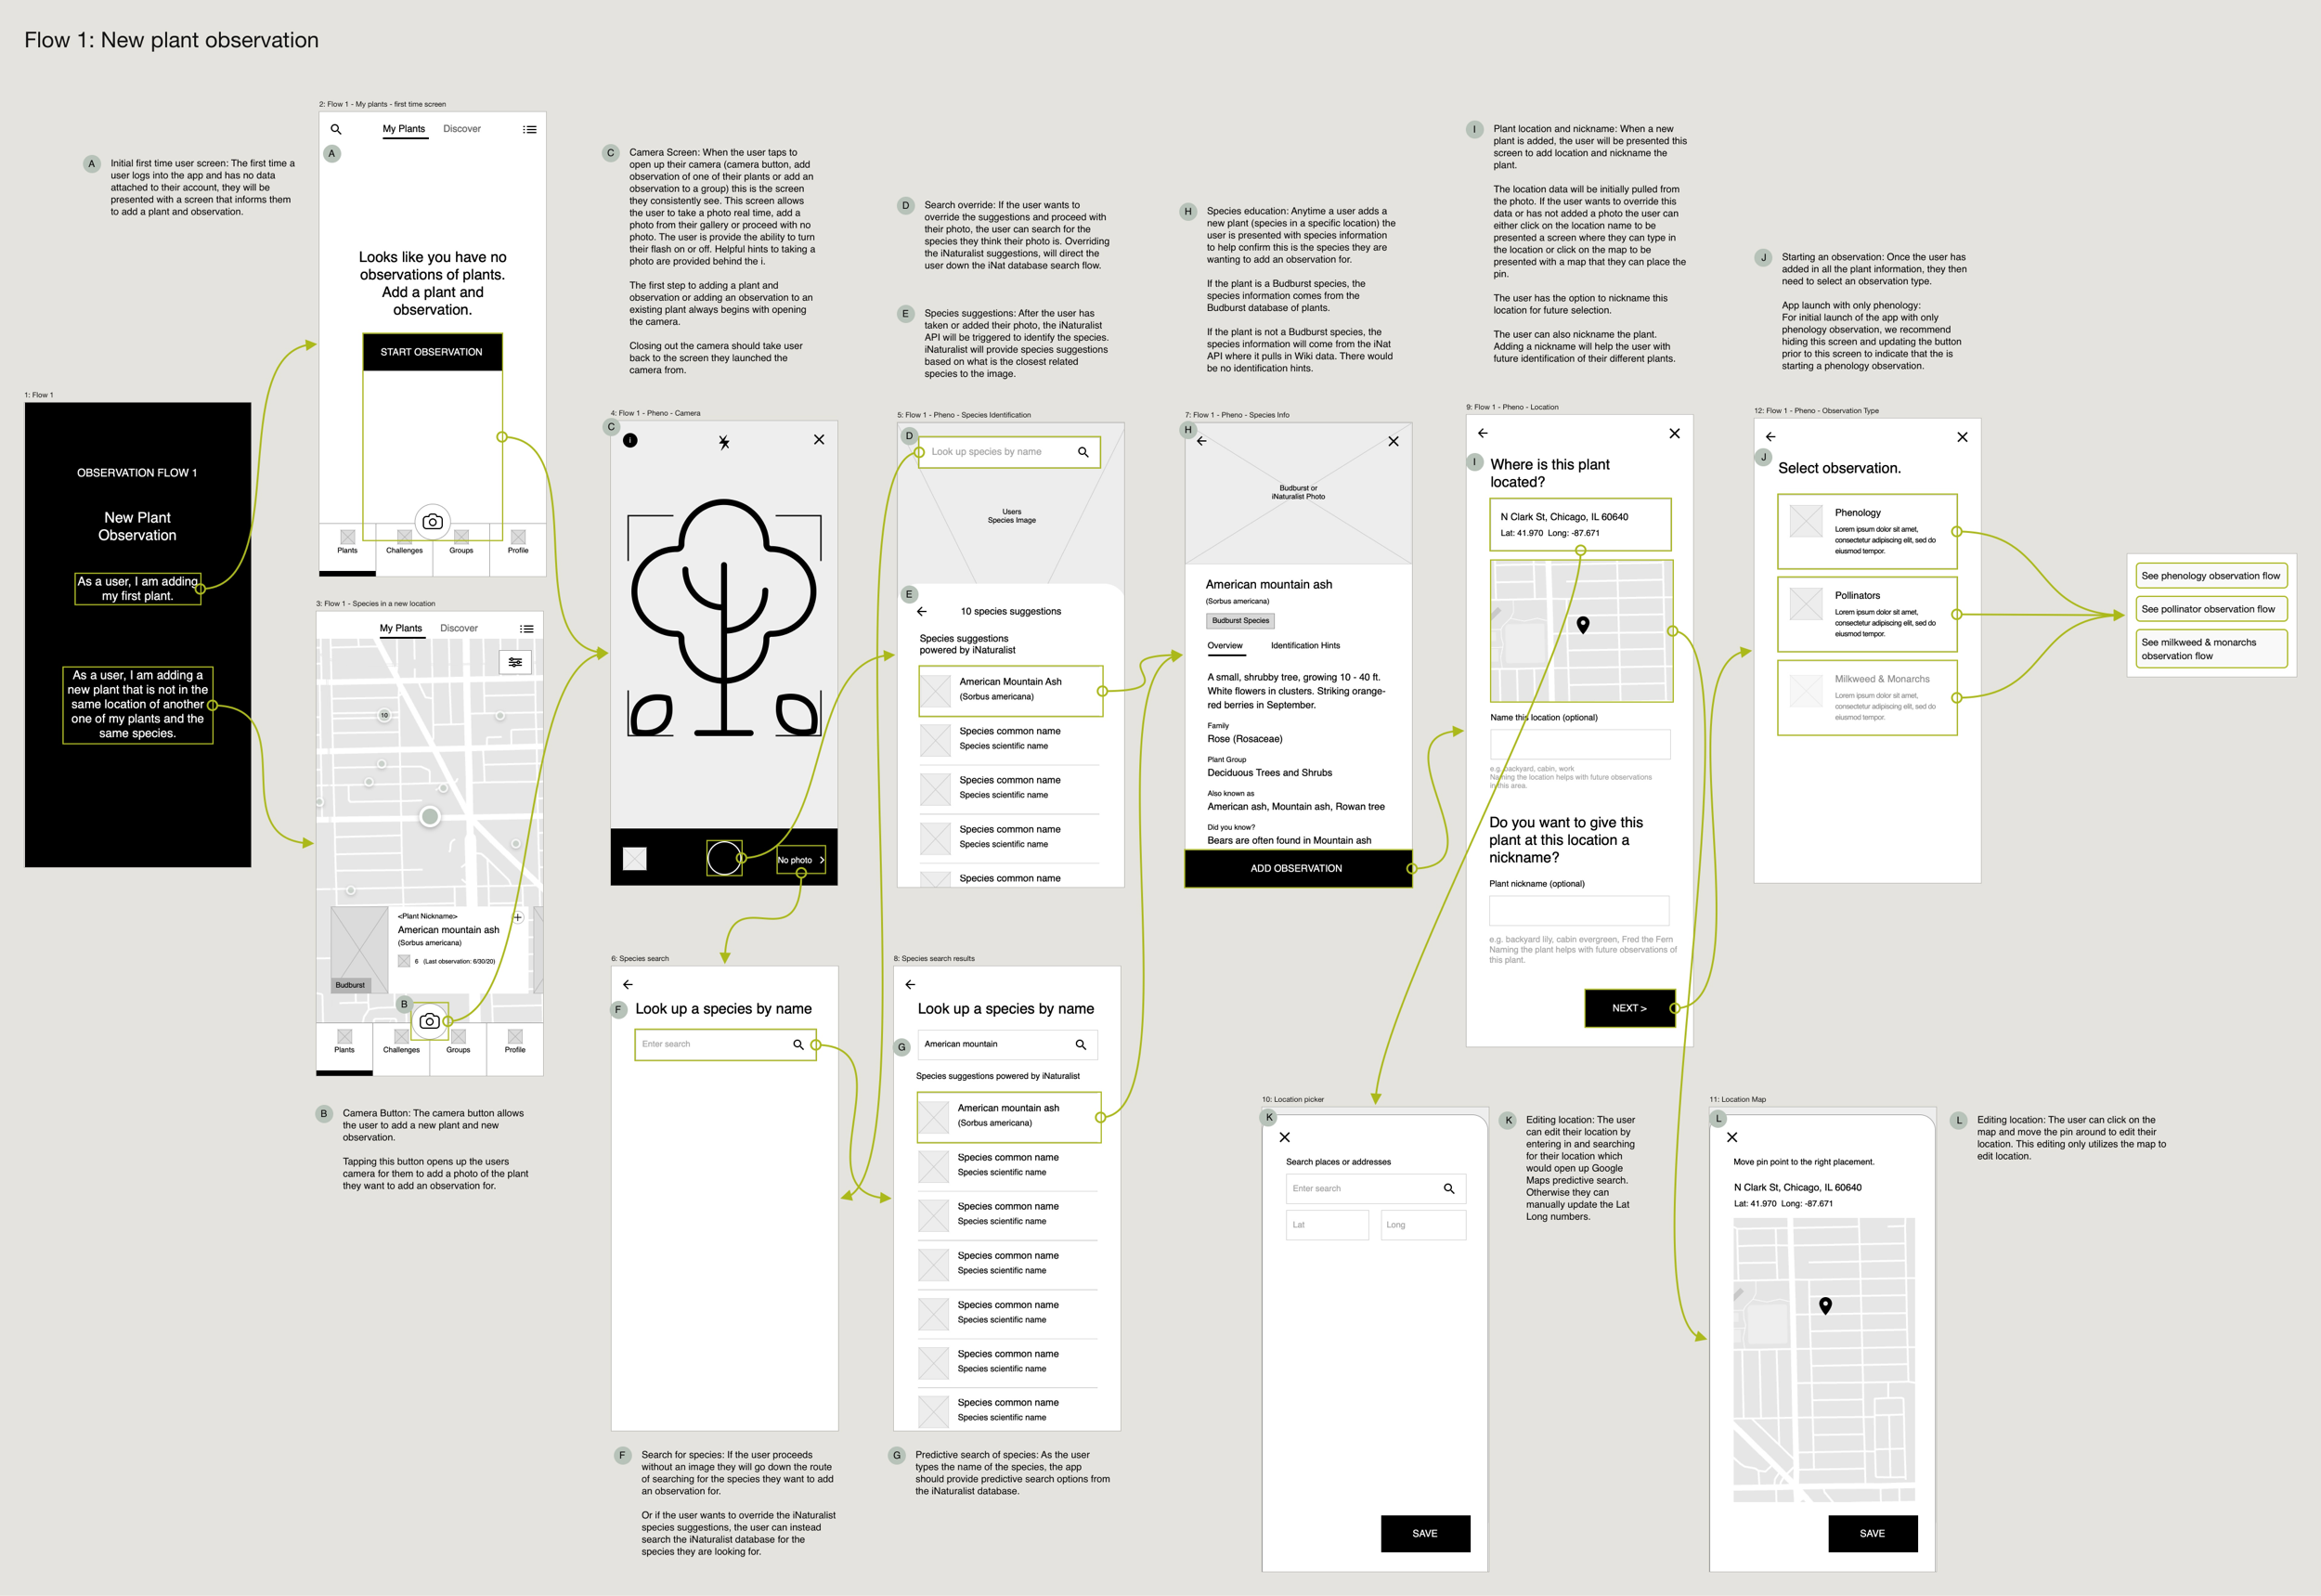
add observation flow
Predictive Add Observation Flow
We reworked the observation flows to account for real time photos and tapping into iNaturalist image recognition API to provide plant suggestions to select from. Once the plant is determined, the user confirms the plants location. If the type of plant and location matches another plant they have observed, the app will automatically detect this connection and add the data to an existing plant. The user is then asked to select an observation type (phenology, pollinator or milkweed + monarch data) and is guided through simple questions.
Locate Plants Near Me
We created an interactive map for the user to locate the plants they have observed or other members have within their current location. This promotes real time crowdsourcing of phenological data and plant discovery.

challenges and badges earned
Seasonal Challenges to Encourage Ongoing Engagement
Budburst originally was trying to promote participation in seasonal research projects. To encourage contribution and engagement of these research projects, we renamed them as Challenges within the mobile app. Members can simply add an observation to a challenge and earn a badge, which equals a contribution to a research project. Each season, Budburst adds new challenges to help encourage members to go out and locate certain plants near them.

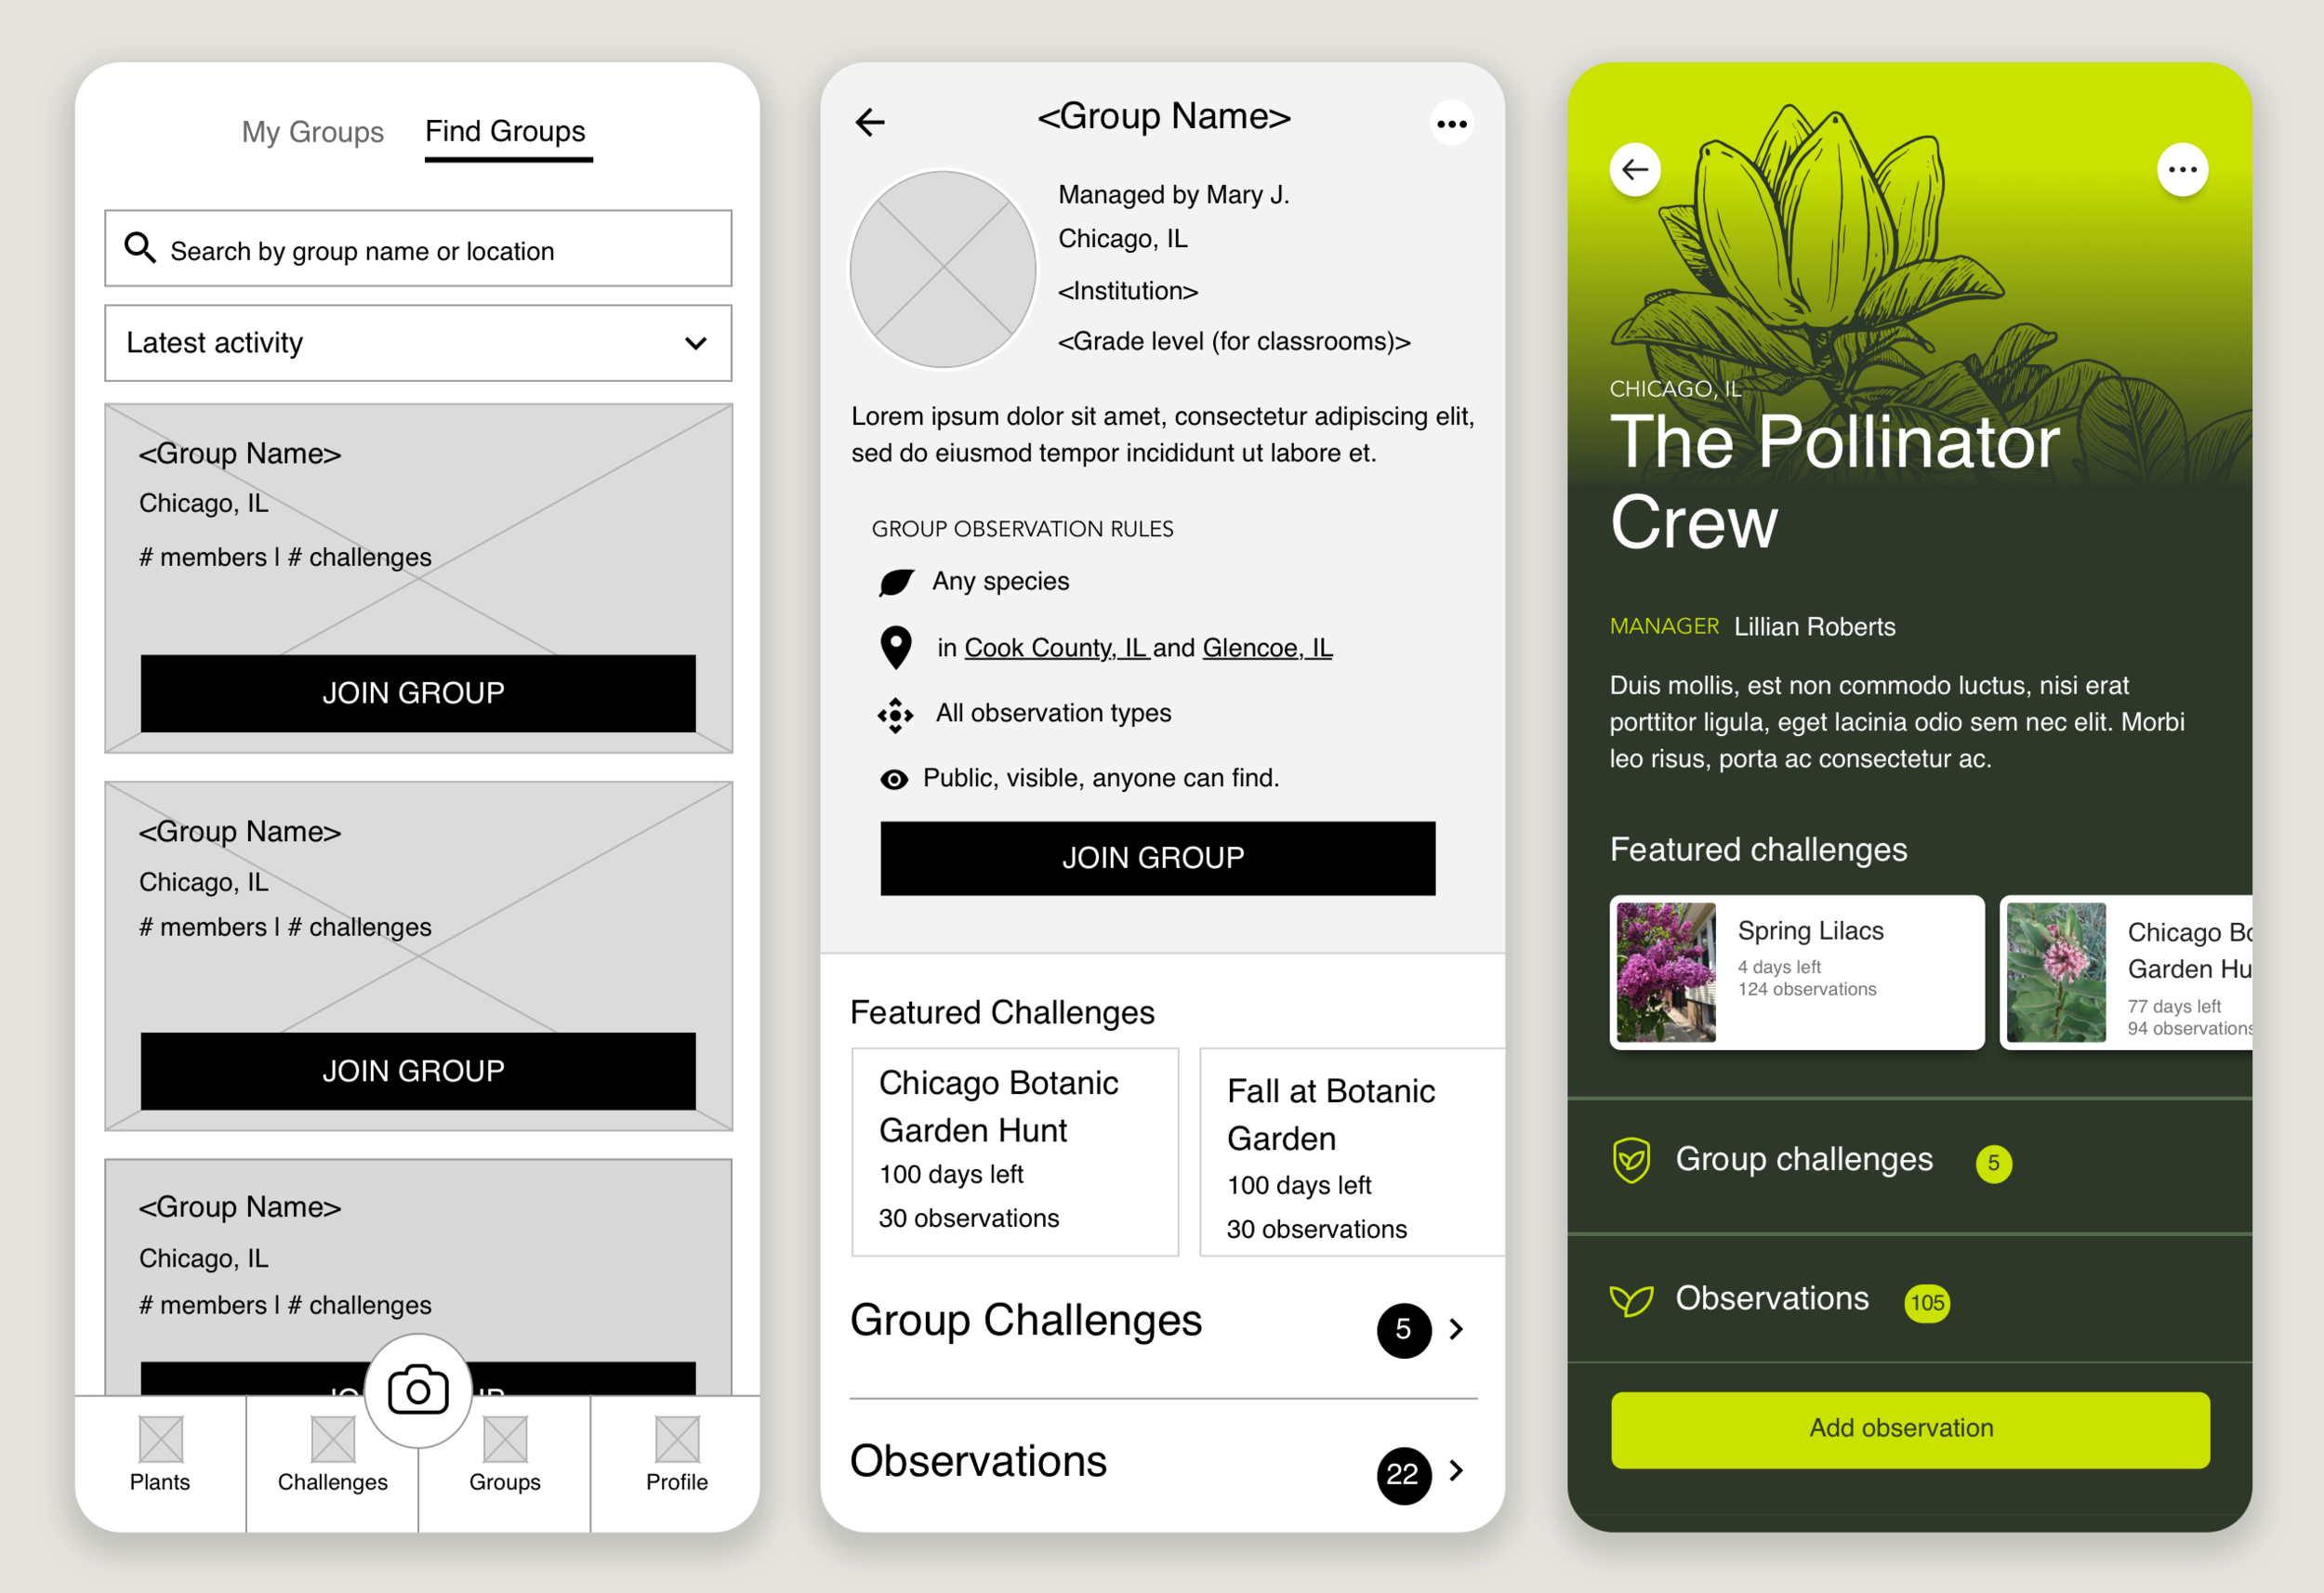
find groups and group profile
Collaborate in Groups with Other Community Scientists
Working as part of a team can make participation even more rewarding. Within the mobile app, we built a community where members are encouraged to join a Group, start their own, and begin contributing data to the group. They work together to collect certain plant groups or simply a way to see what their community is observing.

my profile and milestones
Progress Tracking Profile
In order to help members keep track of their contributions and drive towards engagement, users can view their overall stats and badges within their profile. Users can also find friends to follow and see what they are observing. This encourages users to hit milestones and contribute towards different observation types as a friendly competition.
Team
UX Strategy and UX Design Lead | Katie Larson
Design Lead | Tony Fonte
Animations | Leah Cranston
Copy | Clark Davis
Illustrations | Katie Danaher
Developed by Tighten

